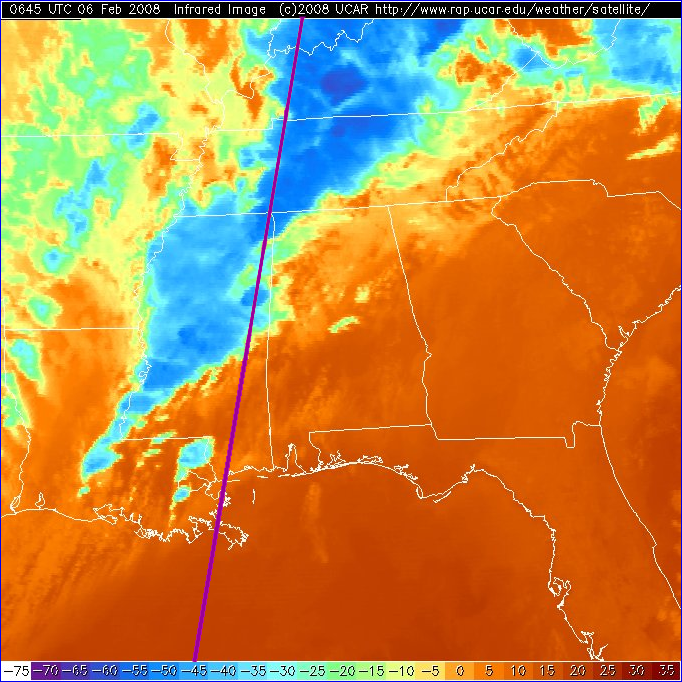
IR image courtesy of NCAR-RAL (http://www.rap.ucar.edu/weather/satellite/)
CloudSat made a nighttime overpass
(approximately 0630 UTC) of the thunderstorms
responsible for the tornadic outbreak over
Kentucky, Tennessee, and Mississippi on Tuesday, 5
Februrary 2008. This extensive tornado outbreak,
which is responsible for more than 50 fatalities
and billions of dollars in damage, occurred in the
late evening and throughout the night of the 5th
into the 6th of February.
The upper image is a nighttime color infrared
image from GOES with an overlay of CloudSat's
descending track. CloudSat transited the region
from north to south, and captured the convective
outbreaks over Kentucky and Tennessee, then
observed the convection over eastern Mississippi.
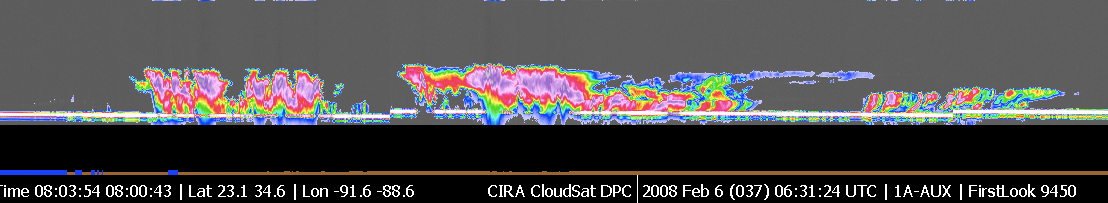
The lower image combines CloudSat QuickLook images
from segments 28 and 29 taken from CloudSat
granule number 9450. The intensity of the
convection is particularly evident in the CloudSat
image - large regions of radar attenuation are
seen (represented by a lack of surface signal
return in the radar image) as well as evidence of
multiple scattering (seen in the radar image as a
sub-surface return) due to the large hail present
in these systems.
Storm reports from this outbreak are available
online from NOAA-SPC: http://www.spc.noaa.gov/climo/reports/080205_rpts.html
CloudSat Profiles Storms Over Texas and
Oklahoma
CloudSat is providing unique information about
recent storms in Texas and Oklahoma (see CNN
coverage of Texas flooding here).
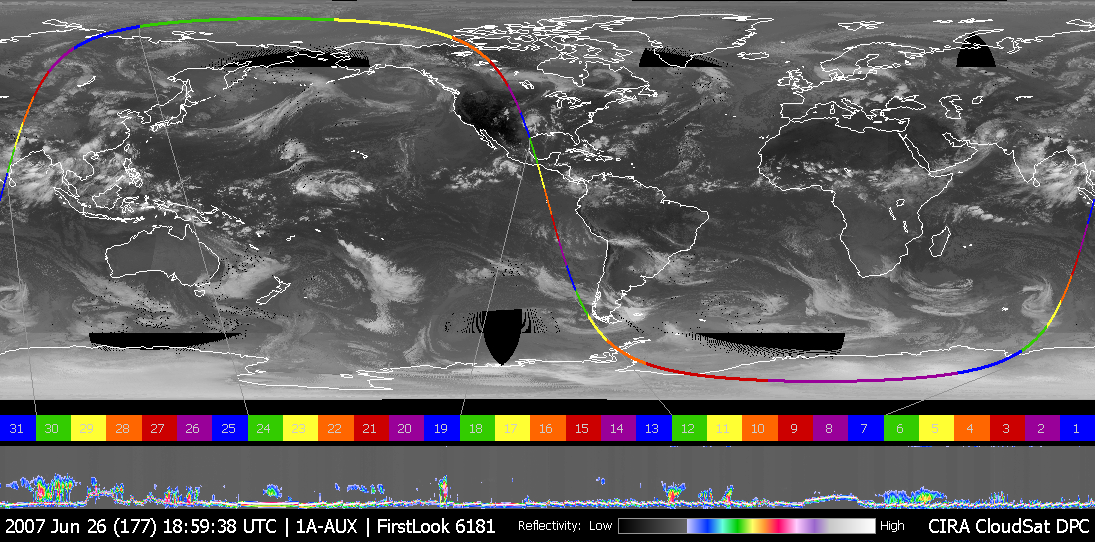
The images above were taken at 2000 UTC (3:00 PM
CDT) on 26 June 2007. In the first image an
obvious storm hangs over the middle of the United
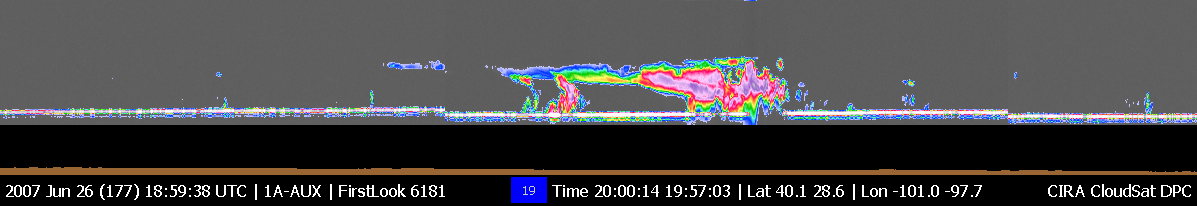
States. The second image is CloudSat data looking,
in profile, at the clouds in this storm. The
vertical axis represents the altitude from the
ground to the top of the atmosphere. The
variations of color intensity are differences in
reflectivity and an indication of the differing
amounts of water and ice in the storm clouds. The
bright line at the bottom of the panel is the
ground return from the radar. This indicates that
the radar penetrated to the ground most of the
time, even through heavy rainfall. Where the
ground return disappears is an indication that the
radar was attenuated by heavy precipitation,
likely exceeding 30 mm/hr, based on previous
studies. From one side to the other, the bottom
panel is approximately 800 km, and the vertical
scale from top to bottom is approximately 30 km.
The CloudSat data provide analysts and forecasters
with a view of storms never before available.
Cross-sections like these provide a view of the
internal structure of these storms, giving
information about the intensity, rainfall rates,
and cloud organization.
CloudSat Profiles Rain Off
Pakistan
A recent CNN
article describes flooding and associated
evacuations in the Baluchistan province of
Pakistan on 25-26 June 2007. A CloudSat overpass
of the region (image above; click to enlarge)
shows an intense precipitation cell over the
Arabian Sea off the south-west coast of Pakistan
at 0918 UTC (2:18 PM local time) on 25 June.
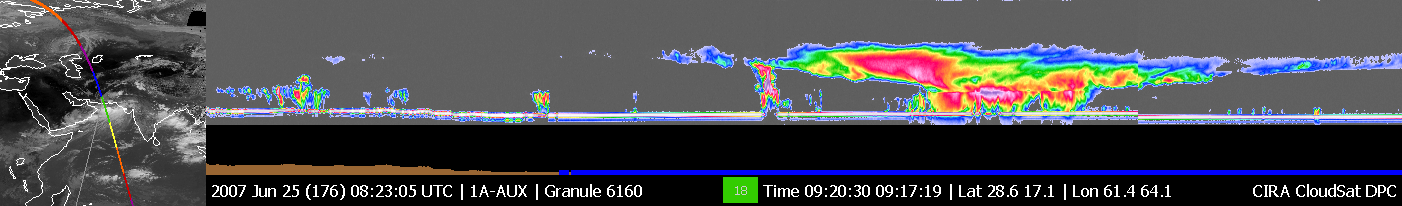
CloudSat Profiles Torrential Rain in
China
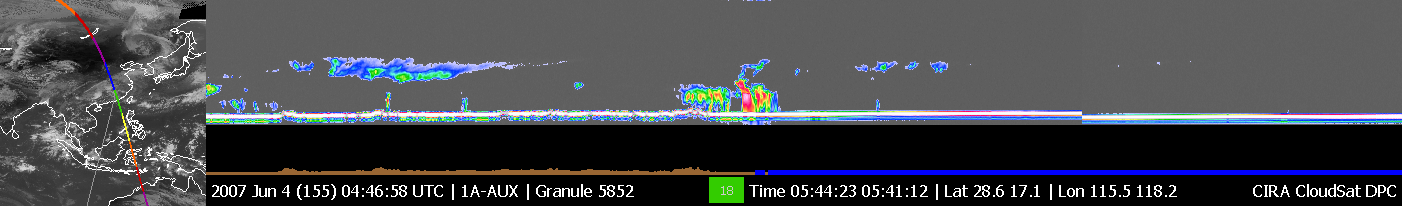
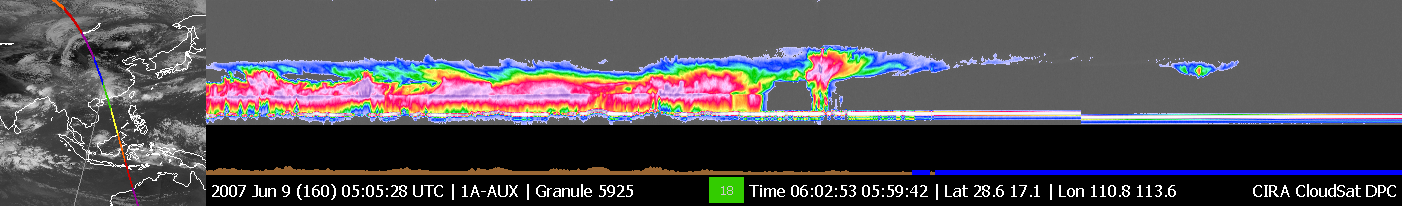
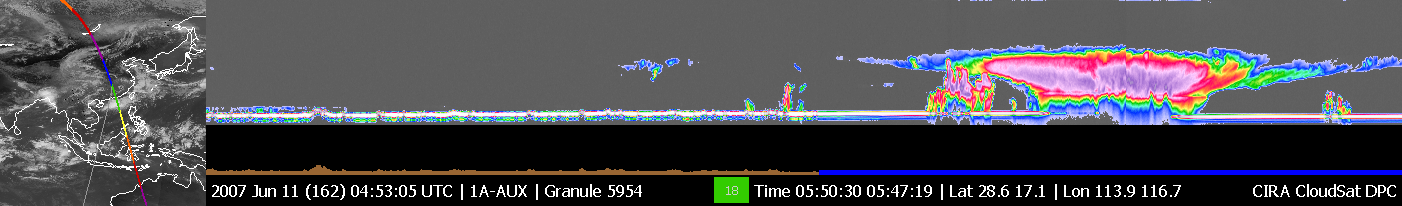
CloudSat's Cloud Profiling Radar collected a
number of cross-sectional profiles of recent heavy
tropical rains over China's southern coast. During
the week of 4-11 June 2007, large areas on and
near China's southern coast received up to 200 mm
(8 inches) of rain, with some areas topping 500 mm
(20 inches). (See
article and rain map at NASA's Earth
Observatory. The three images above (click to
enlarge) show the evolution of the rain and cloud
field, with the CloudSat ground track overlain on
infrared satellite imagery on the left, together
with a CloudSat Quicklook image (corresponding to
the green segment of the displayed ground track)
on the right. CloudSat Quicklook images are
available here.
The images show daytime segments of the orbit on
4, 9, and 11 June, with the satellite traveling
northwest along the track on each day (right to
left in the quicklook image). The coastline is
marked by the transition of the topography plot
from blue to brown (just above the text in the
quicklook images).
CloudSat profiles Tropical Storm
Andrea
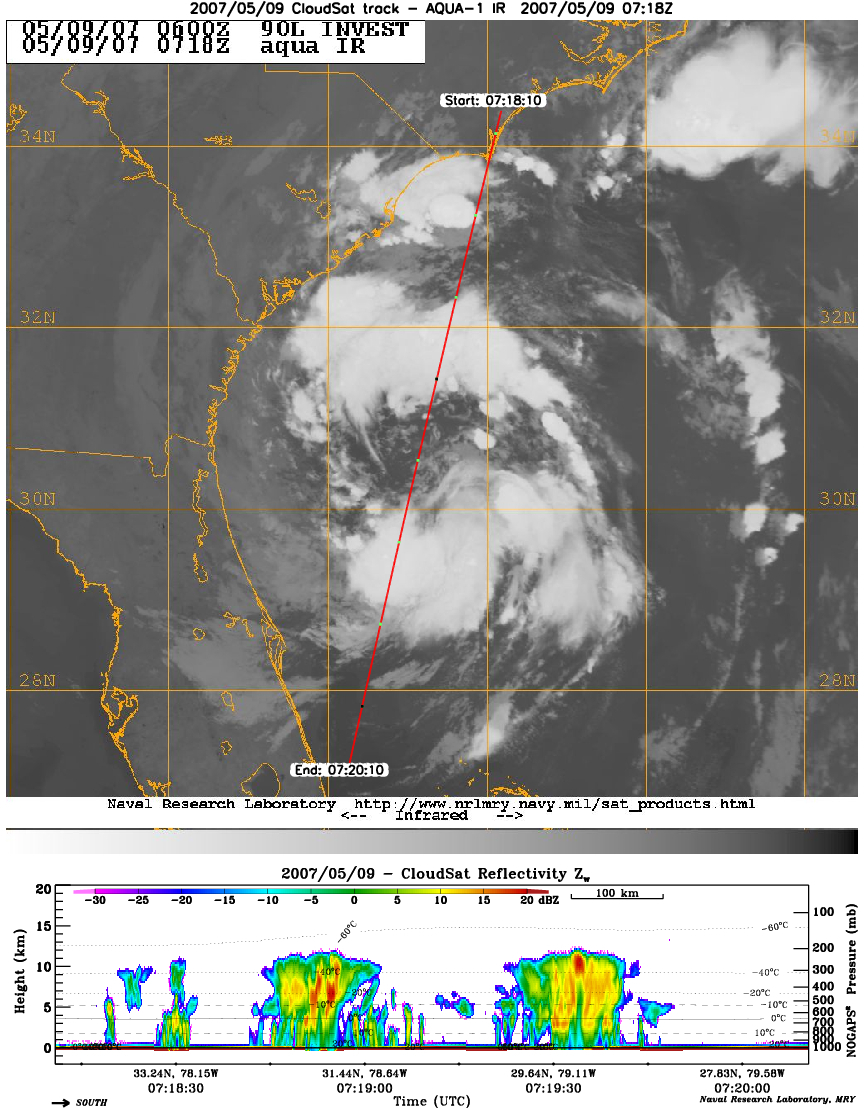
CloudSat's Cloud Profiling Radar captured a
profile across Tropical Storm Andrea on Wednesday,
9 May 2007 near the SC/GA/FL Atlantic coast. The
upper image shows an infrared view of TS Andrea
from the MODIS instrument on the Aqua satellite,
with CloudSat's ground track from 0718-0720 UTC
(3:18-3:20 EDT) shown as a red line. The lower
image is the vertical cross section of radar
reflectivity along this path, where the colors
indicate the intensity of the reflected radar
energy. CloudSat orbits approximately one minute
behind Aqua in a satellite formation known as the
A-Train. [Images courtesy of the Naval Research
Laboratory-Monterey]
CloudSat is an experimental satellite that uses
radar to observe clouds and precipitation from
space. CloudSat orbits in formation as part of the
A-Train constellation of satellites (Aqua, CloudSat, CALIPSO, PARASOL, and Aura).
Orbital elements (two-line elements or TLEs)
for CloudSat are available here
(CloudSat DPC). CloudSat ground tracks may be
predicted using tools located on this NASA
LaRC page. Orbital elements at the LaRC page
are updated regularly, but use the DPC link for
the very latest TLEs.
For an overview document (PDF) of science and
research themes, click here.
The BAMS 2002 article (PDF) describing the
CloudSat mission is available here.